highstocks 是一个功能强大且丰富的股票资讯类图表的库,其具有代表意义的项目还有 highcharts 和 highmaps。我最近在做一个股票资讯类的项目,所以需要用到这个图表库,由此篇文章开张记录下使用该库的各种问题和小技巧。方便以后他人遇到问题及时解决。首先我们就来谈一谈如何在 react 项目中使用它。

创建 React 项目

我习惯使用 create-react-app 这个工具来做些 demo 项目的演示,所以大家可以自己安装一个 create-react-app 跟随着我一起学习 highstocks。 创建一个 highstocks-test 的项目。

1
2
3
4
5
➜  Project create-react-app highstocks-test
Creating a new React app in /Users/myCode/Project/highstocks-test.

Installing packages. This might take a couple minutes.
Installing react, react-dom, and react-scripts...

安装 highstocks 包

我用 yarn 替代了 npm,当然你也可以用 npm 进行安装。看名字虽然是 react-highcharts,实际股票相关的一些图表功能都在这个包里面。

1
yarn add react-highcharts --save

寻找股票数据源

要显示一个股票的烛台图,我们需要有数据的支持,比如开盘价、最高价、最低价、收盘价、交易量、时间等。这些数据我们可以自己模拟(这有点费劲儿),也可以从网络上找现成的数据。知名的数据源有新浪、搜狐、yahoo 等,我再给大家推荐几个获取这些数据的地址。 聚合数据:https://www.juhe.cn/ lianglee: http://www.liangyee.com/apiDetail/a1cc7246-c806-453b-9cbe-022b599360b8 如果大家觉得研究接口麻烦,想先看看效果,那么可以使用 highstocks 官方例子中一些固定的数据地址。比如官方给出的烛台图的数据源:https://code.hcharts.cn/highstock/hhhhib,我们可以看到里面有一段 getJSON 的代码,里面的 URL 就是官方为了演示案例做的一些固定数据。

1
$.getJSON('https://data.jianshukeji.com/jsonp?filename=json/aapl-ohlcv.json&callback=?'.....

由于官方例子已经很完善了,我就不拿官方的地址举例,我们来找一个 lianglee 的数据源来做烛台图效果。通过官方的 API 接口,我们可以取到指定时间段的某支股票代码的数据。如下图: 
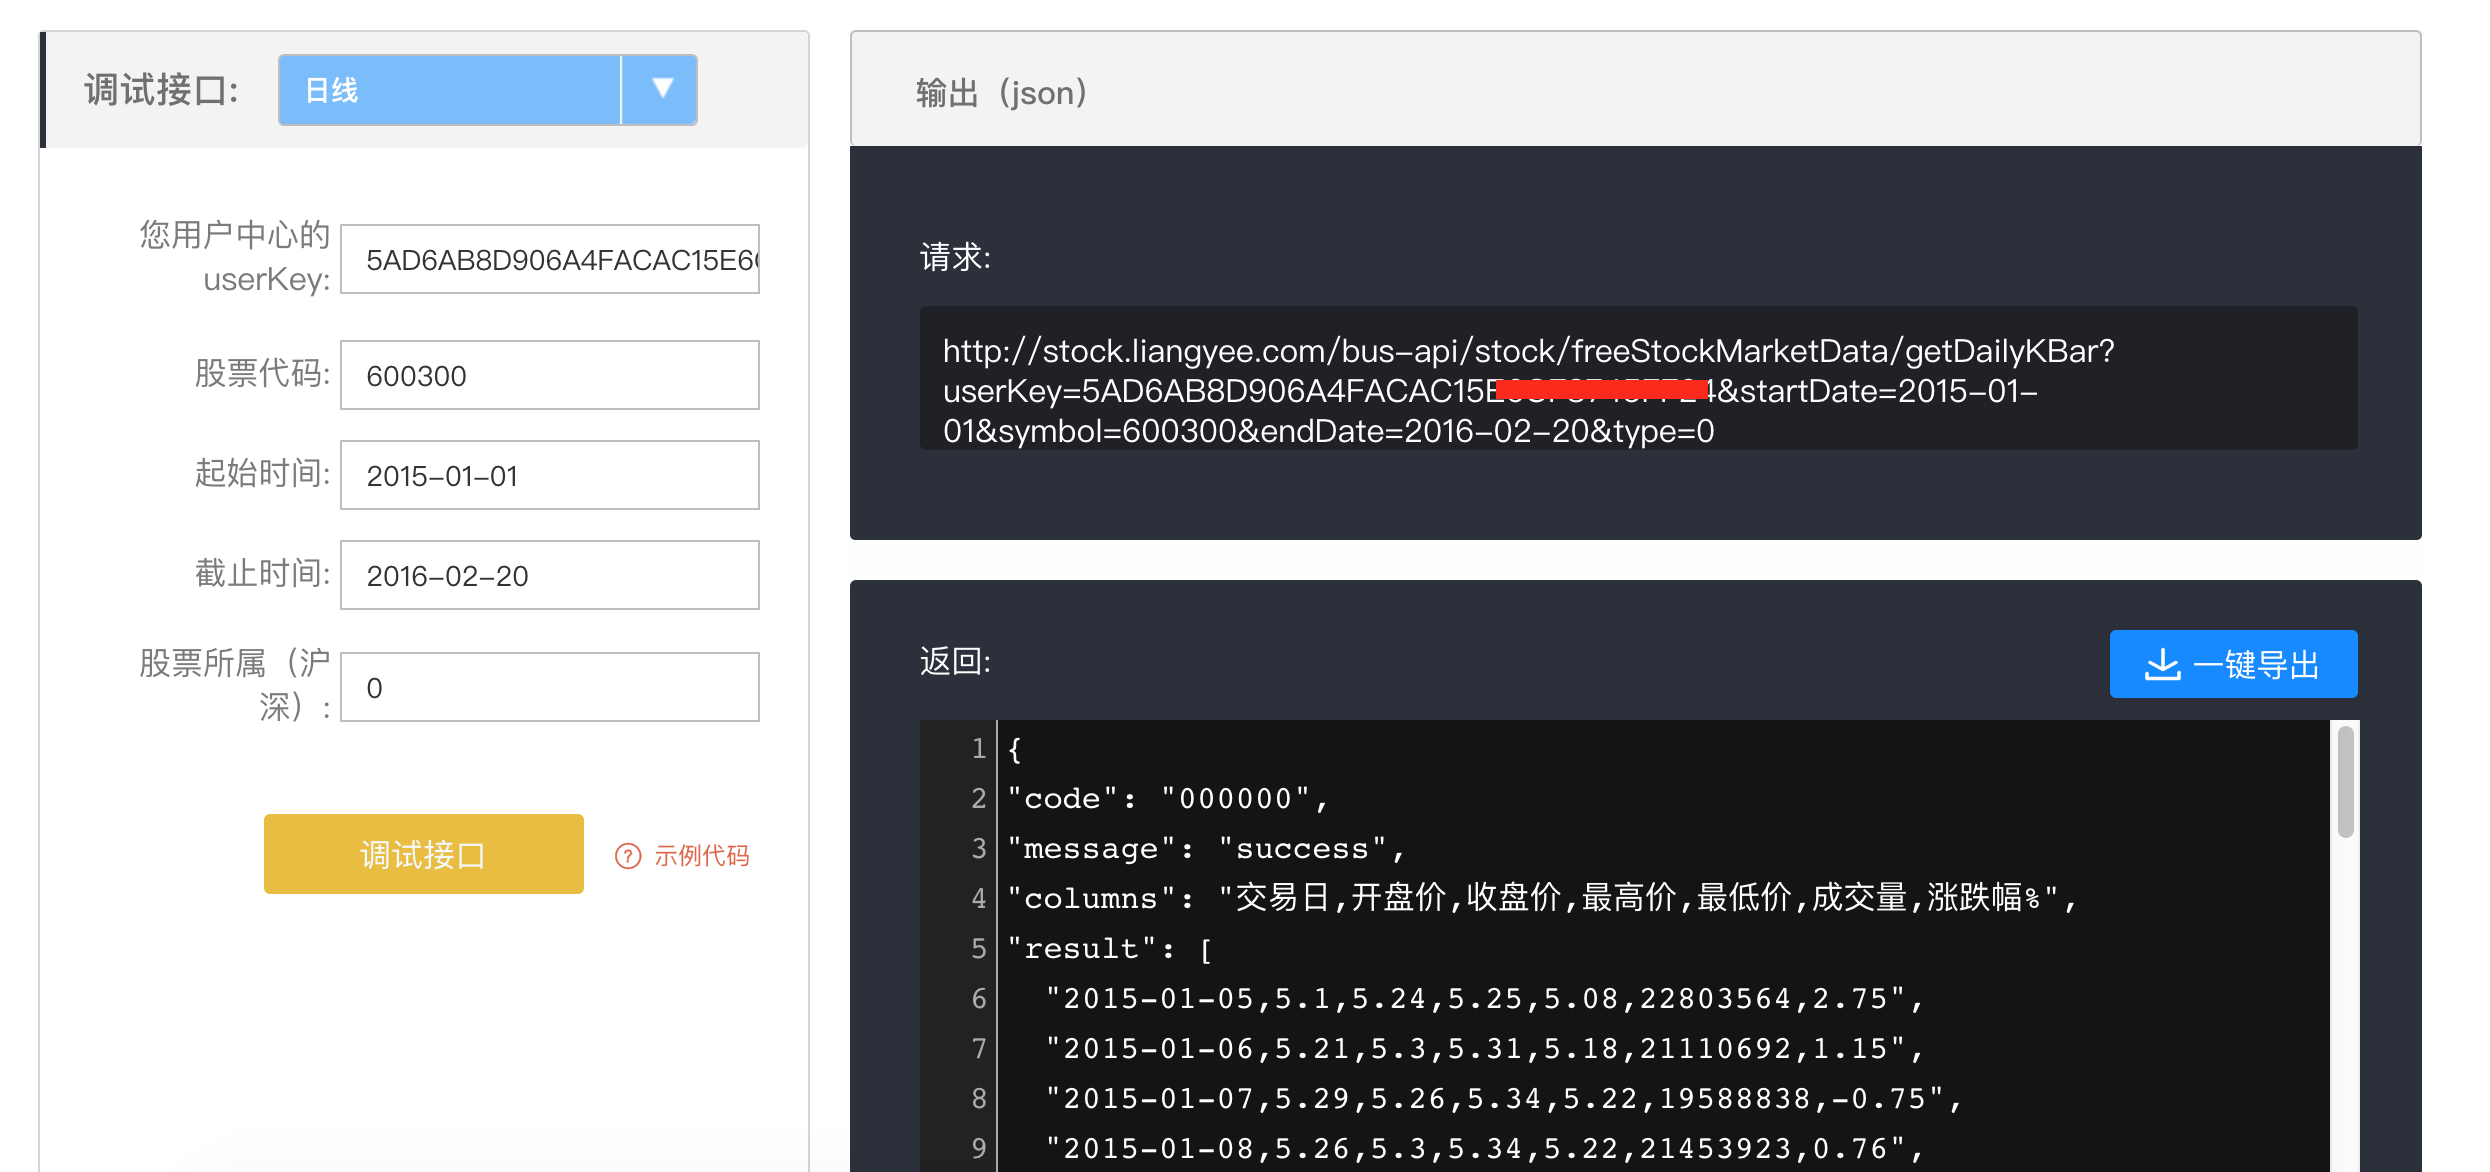
接下来我们要在测试项目中来访问这个地址并把请求的数据显示出来,用于我们后面给 highstock 提供数据源。

获取股票数据源

官方的接口返回的是一个 json 格式的数据,大家可以用各种支持 json 的包来获取这个数据源,我这里使用 d3,d3 在这方面做的还是非常完善的,首先把 d3-request 这个包加入到项目中。

1
yarn add d3-request --save

然后我们打开项目中已经为我们创建好的 App.js,从 d3-request 包中引入 json 方法。如下图: 
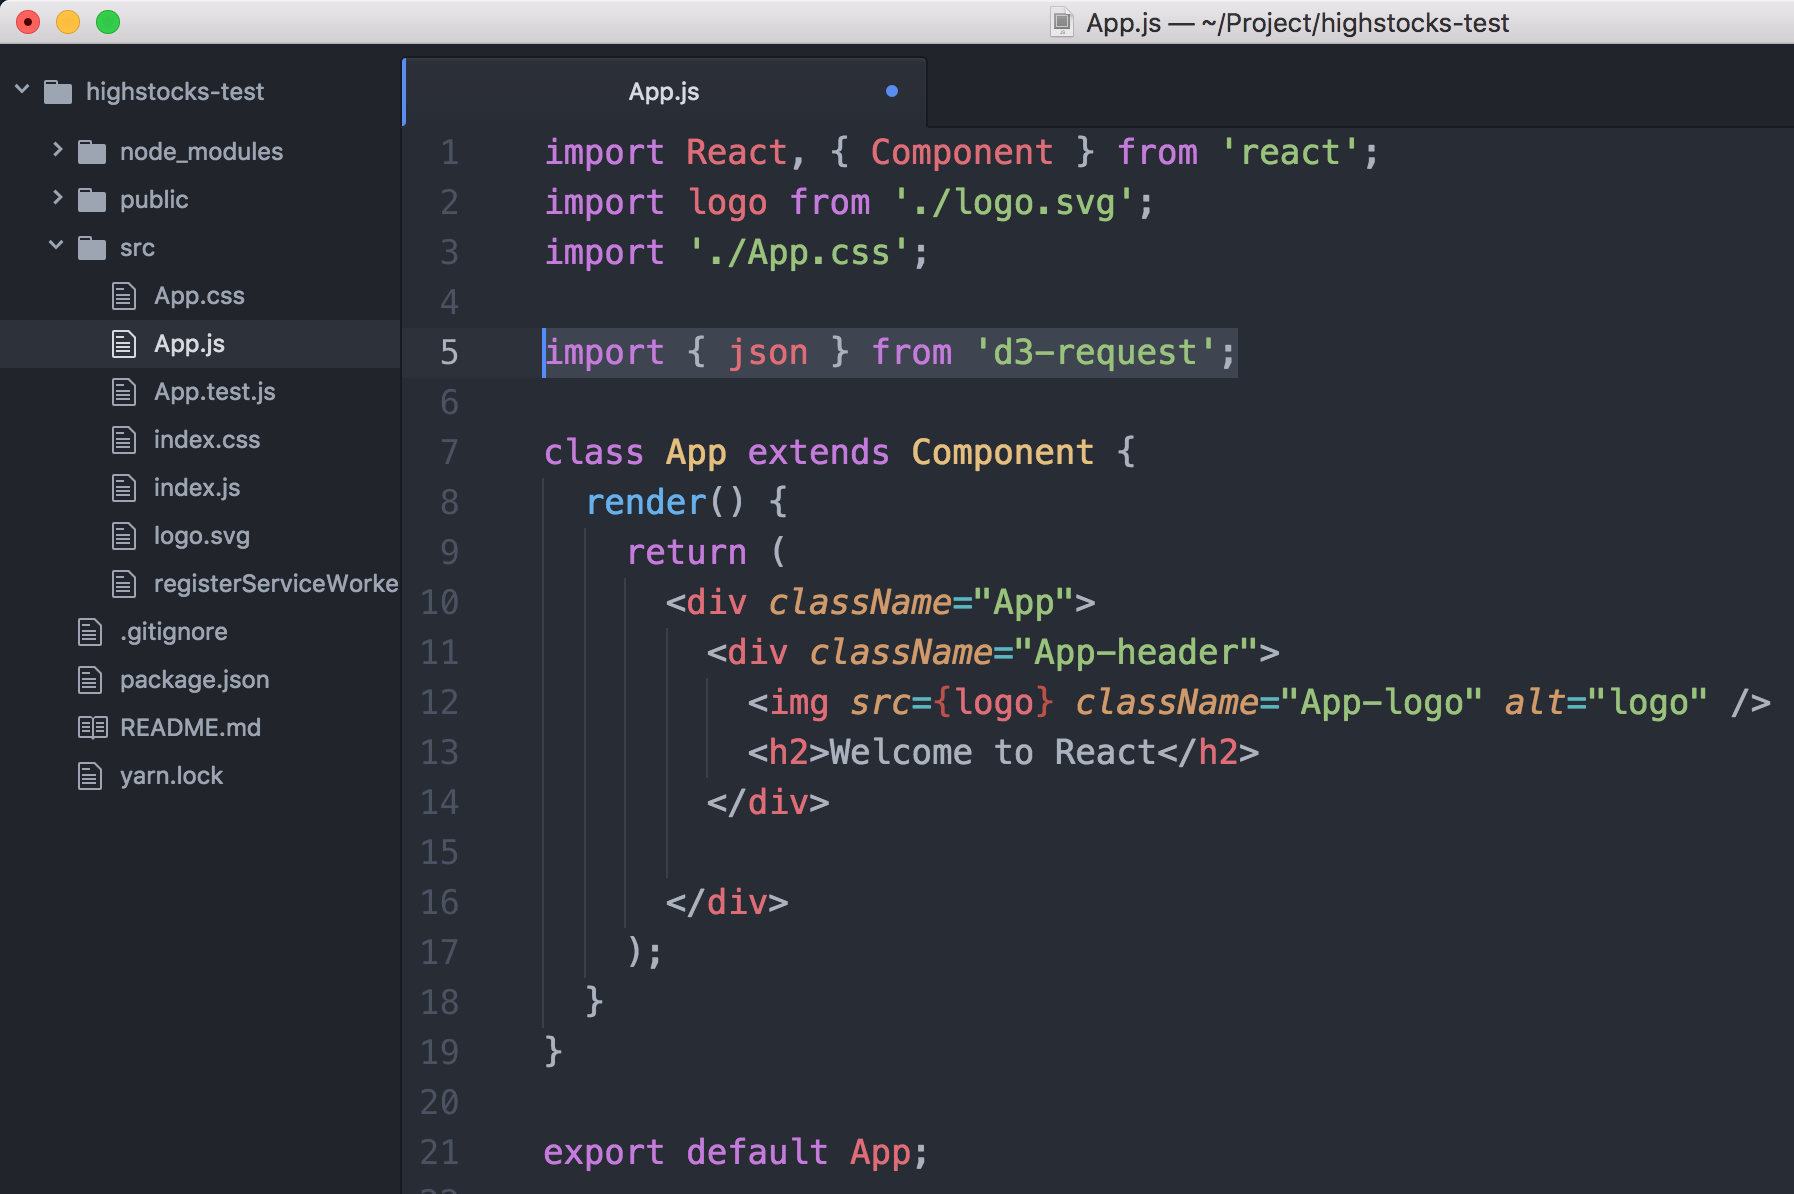
获取数据我们一般是在 componentWillMount 函数中进行的,所以获取方法就写到这里。同时我也创建了构造函数,方便后面我们用 react 的 state 来储存一些数据:
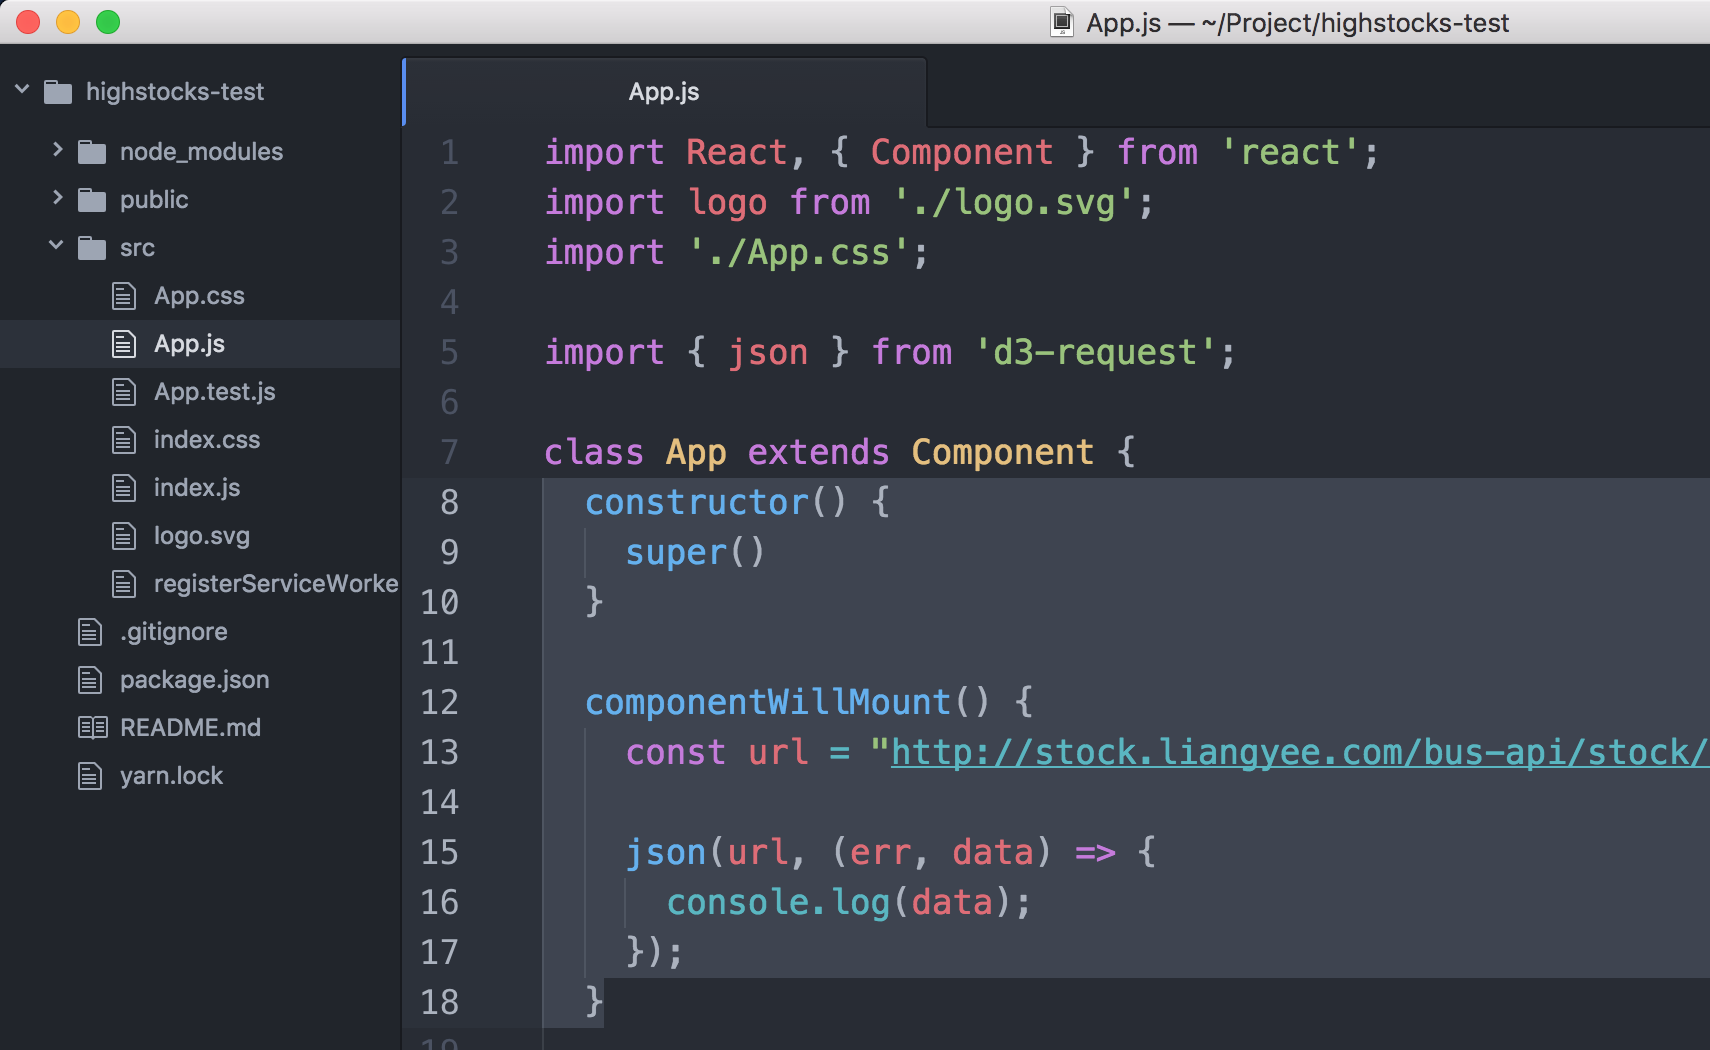
 写到这里我们数据其实已经获取到了,使用 yarn start 启动项目,如果你用的是 npm 那么就用 npm start 启动项目,启动后页面会自动打开。此时打开浏览器的 Console 就能看到打印的信息了。如下图: 
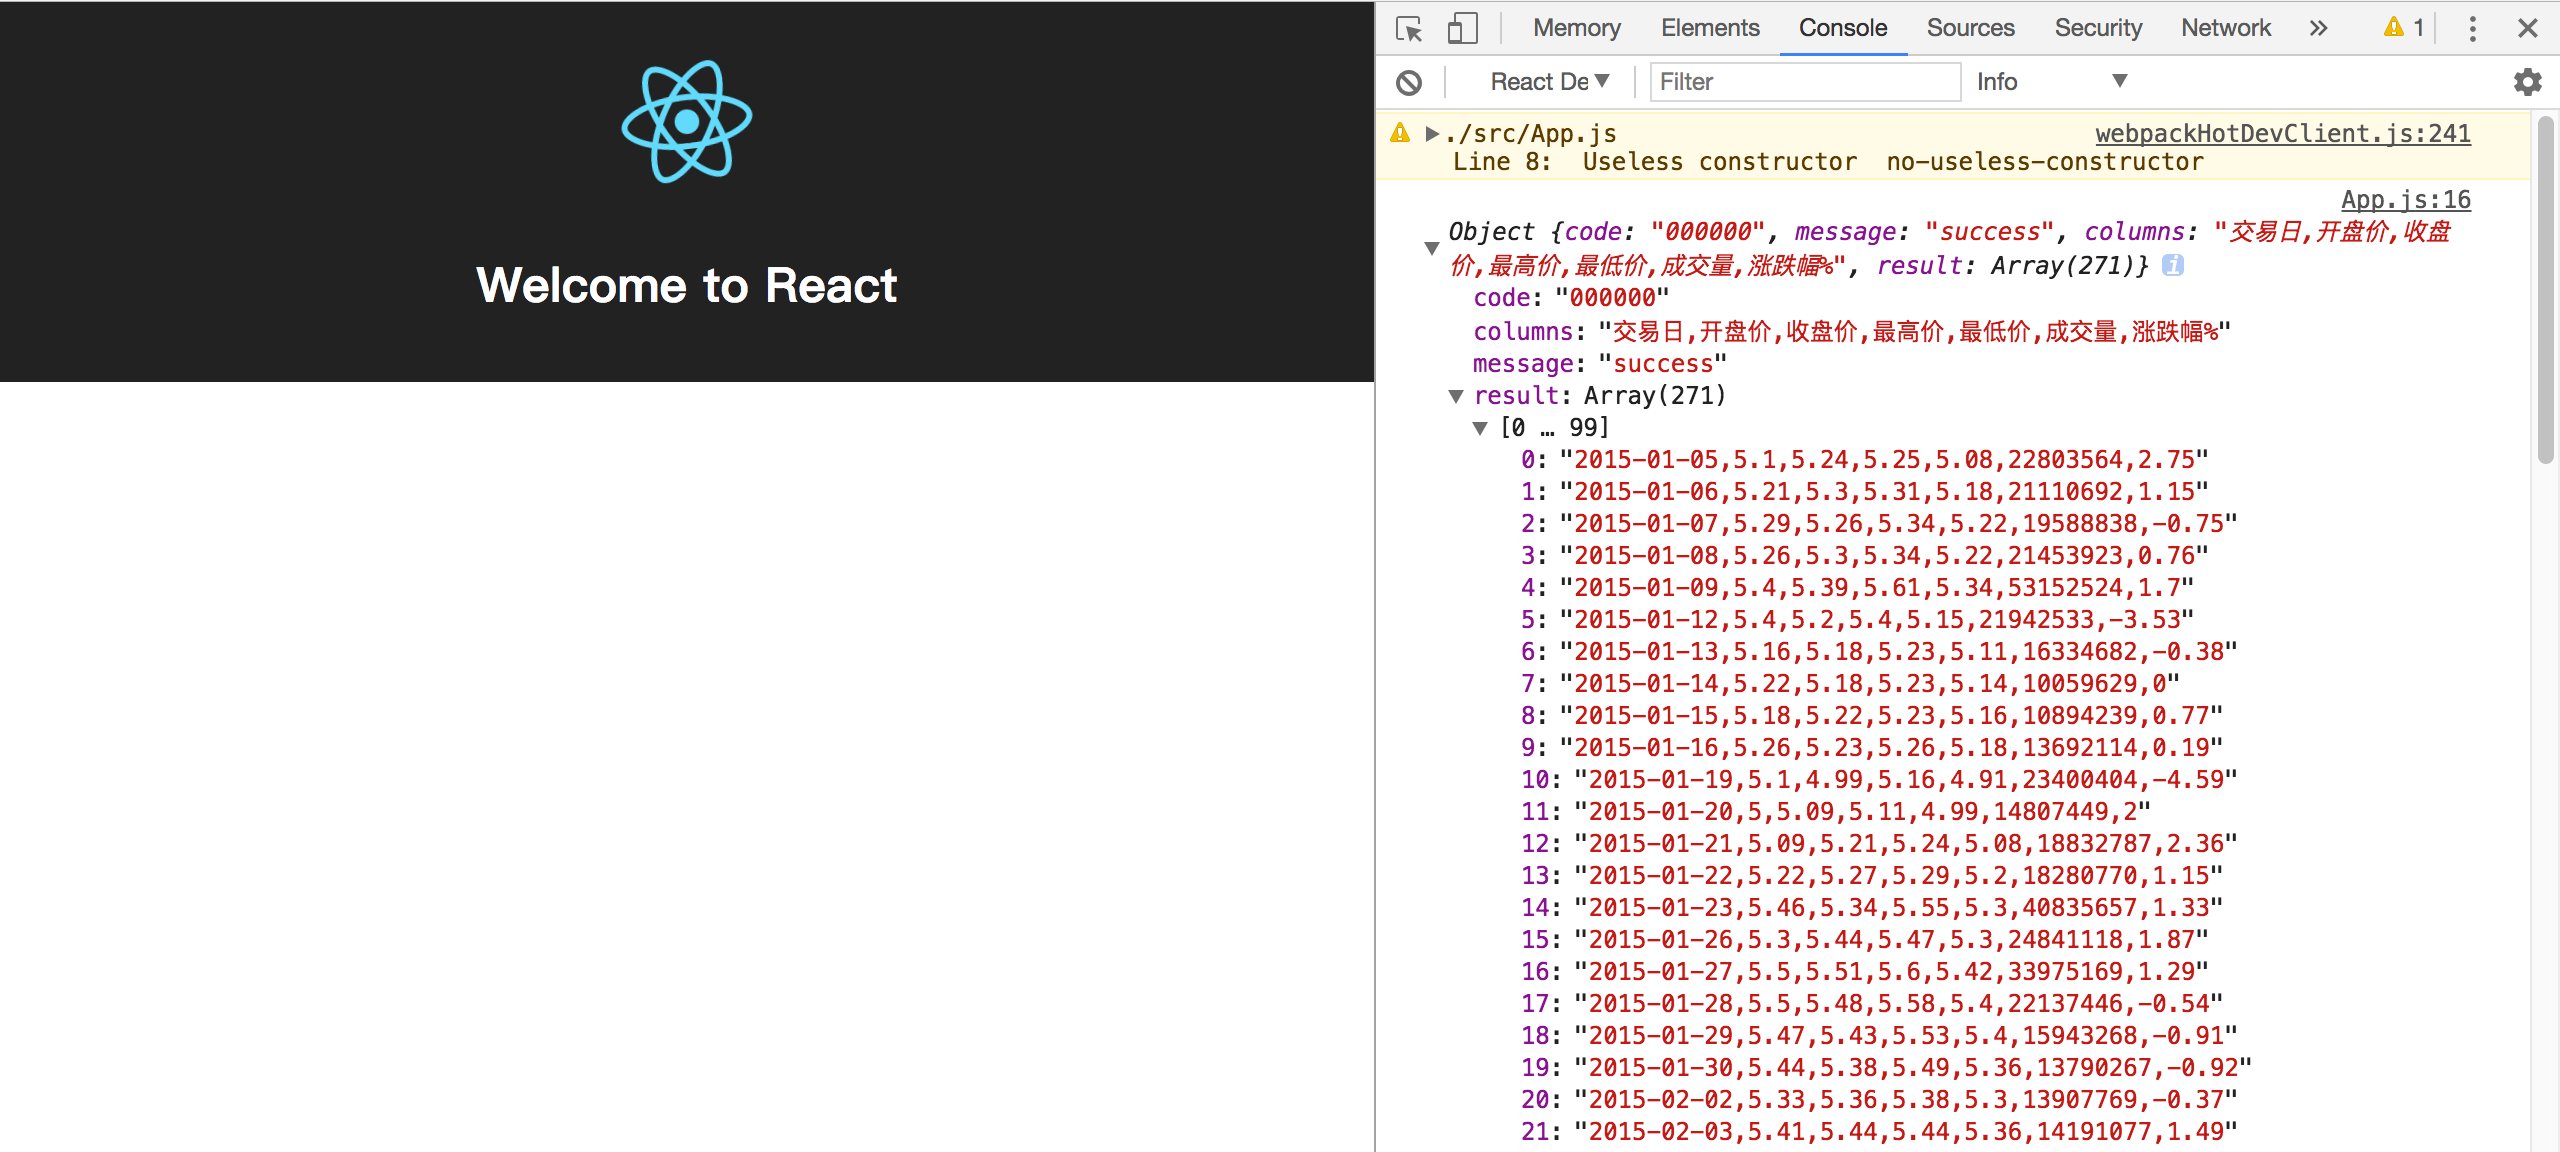
现在我们所需的数据都有了,但还有一个问题需要我们解决,我们获取的时间是一个字符串格式的时间,要把 2015-01-05 这种时间转换为时间戳(1970-1-1到现在的秒数),还是用 d3 的一些函数来实现。首先我们导入 d3-time-format 包。

1
yarn add d3-time-format --save

然后项目中从 d3-time-format 导出 timeParse 方法。然后我们定义一个解析的格式,如下图: 
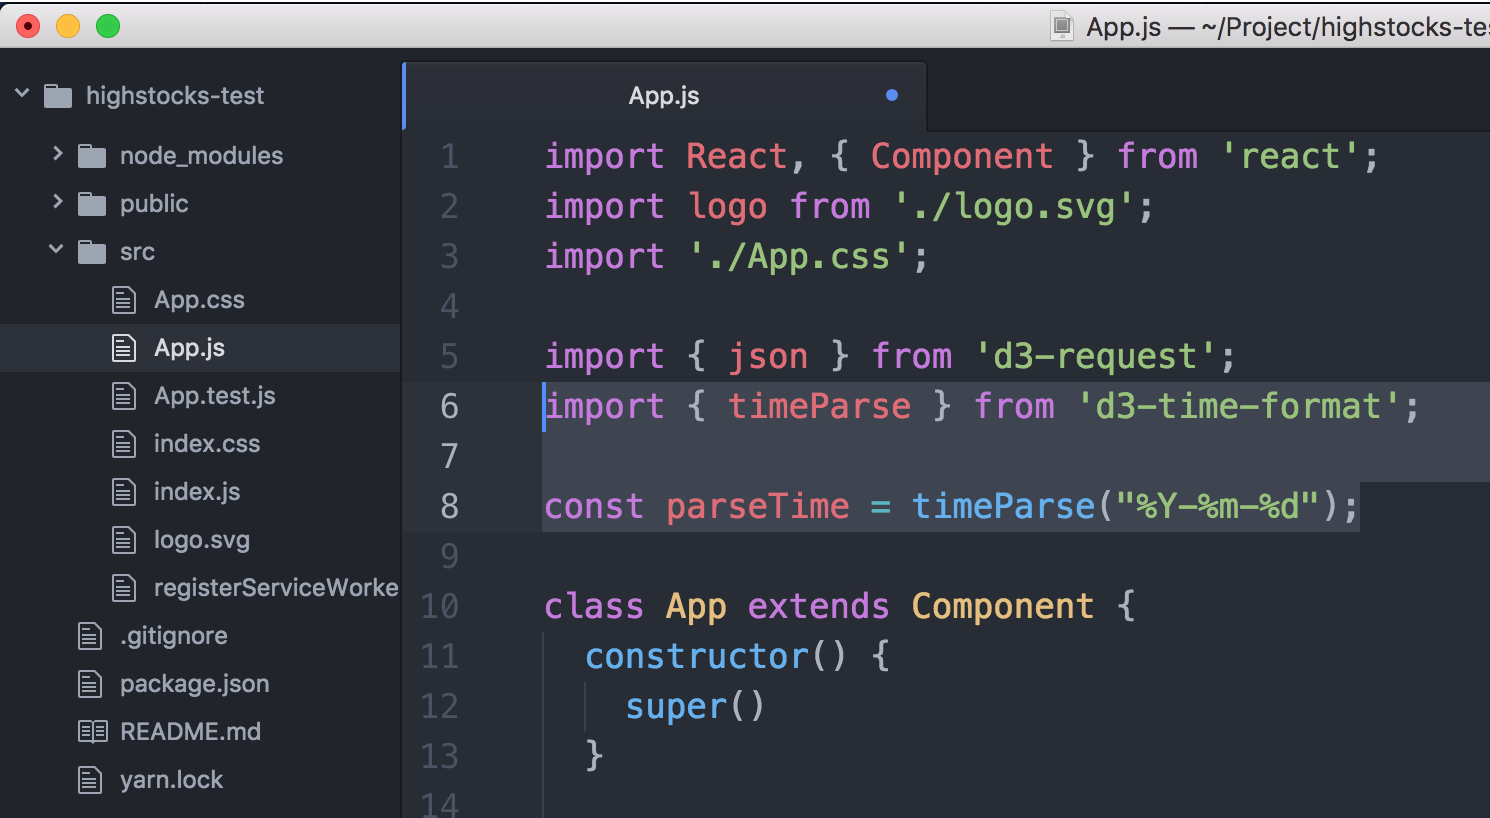
随后在代码中,我们将时间转换为时间戳格式。并创建两个数组,用来给图表传递数据使用。我们把需要的数据放到这两个数组中。如下图代码: 
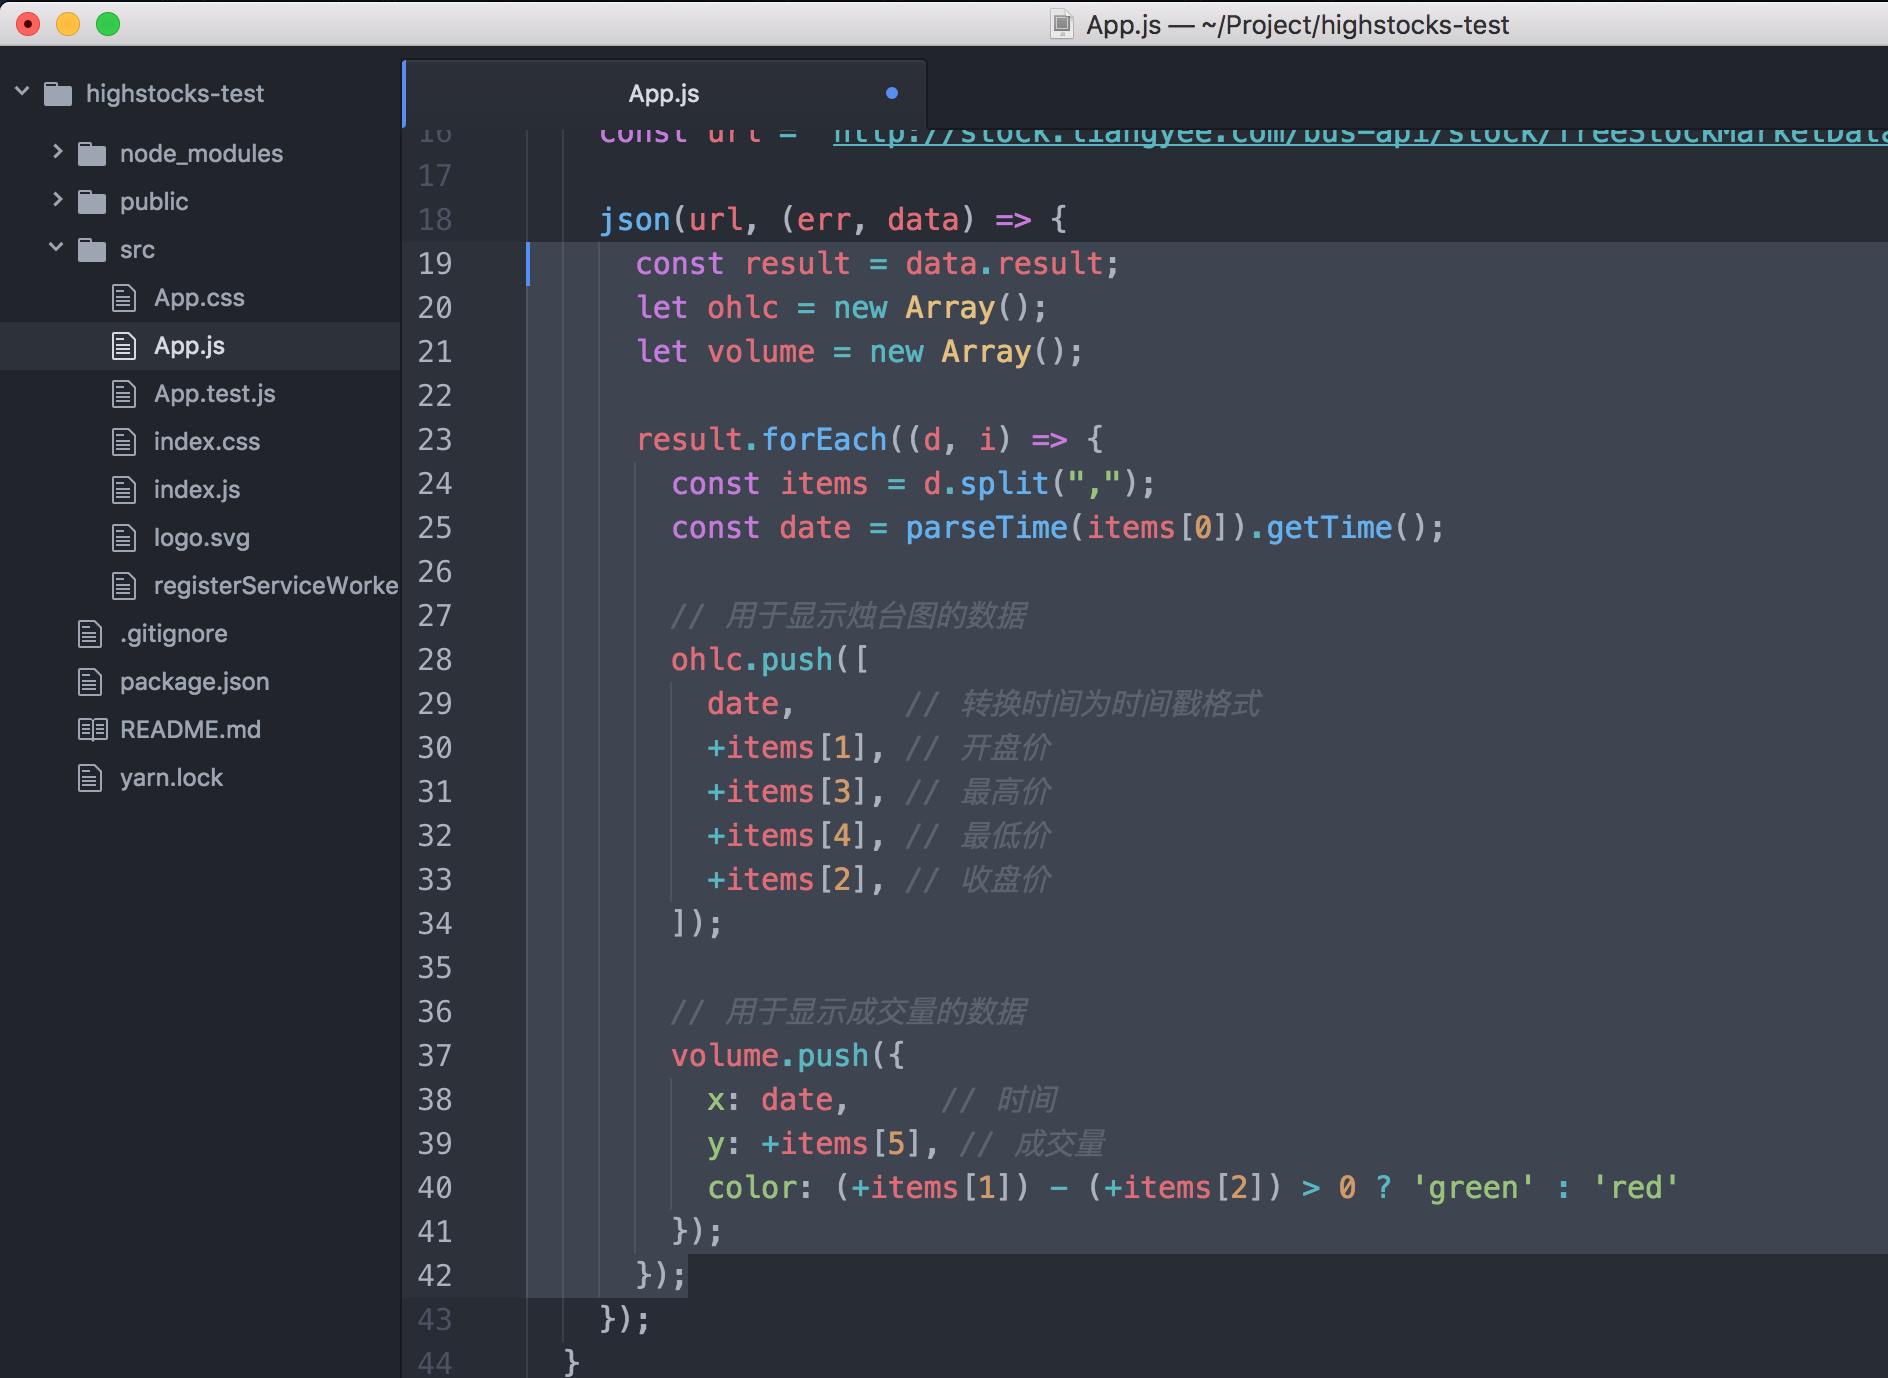
此时我们如果打印两个数组,就可以看到我们重组后的数据格式了,接下来就是显示图表了。

显示图表

首先从包中导入图表方法:

1
import ReactHighstock from 'react-highcharts/ReactHighstock.src';

然后在要显示图表的位置,插入如下代码:

1
<ReactHighstock config={this.state.config}/>

我们看到这里使用了 this.state.config,其实整个图表初始化就使用了一个 config,这个 config 是一个 json 格式的数据。我们首先在构造函数中把这个 config 设置为空的对象。保证代码可以运行起来。

1
2
3
4
5
6
constructor() {
super();
this.state = {
config: {}
}
}

随后我们在 componentWillMount 遍历完获取的 result 数据后,使用 this.setState 方法设置 config 的数据。如下:

1
2
3
4
5
6
7
8
9
10
11
12
13
14
15
16
17
18
19
20
21
22
23
24
25
26
27
28
29
30
31
32
33
34
35
36
37
38
39
40
41
42
43
44
45
46
47
48
49
50
51
52
53
54
55
56
57
58
59
60
61
62
this.setState({
config: {
rangeSelector: {
selected: 1,
inputDateFormat: '%Y-%m-%d'
},
title: {
text: '测试图表'
},
xAxis: {
dateTimeLabelFormats: {
millisecond: '%H:%M:%S.%L',
second: '%H:%M:%S',
minute: '%H:%M',
hour: '%H:%M',
day: '%m-%d',
week: '%m-%d',
month: '%y-%m',
year: '%Y'
}
},
yAxis: [{
labels: {
align: 'right',
x: -3
},
title: {
text: '股价'
},
height: '60%',
lineWidth: 2
}, {
labels: {
align: 'right',
x: -3
},
title: {
text: '成交量'
},
top: '65%',
height: '35%',
offset: 0,
lineWidth: 2
}],
series: [{
type: 'candlestick',
name: 'AAPL',
color: 'green',
lineColor: 'green',
upColor: 'red',
upLineColor: 'red',
tooltip: {
},
data: ohlc,
}, {
type: 'column',
name: 'Volume',
data: volume,
yAxis: 1
}]
}
});

这个结构第一次看非常复杂,但大家不要慌,你只要关注两个 data,一个是 data: ohlc 一个是 data: volume 这两个数据就是构造整张图表的数据源。我们之前大费周章的处理数据源的时间和其他信息,都是为了给这里传入数据。最终显示图表。当写完这段代码后,我们保存一下,就能看到页面上已经显示烛台图了: 
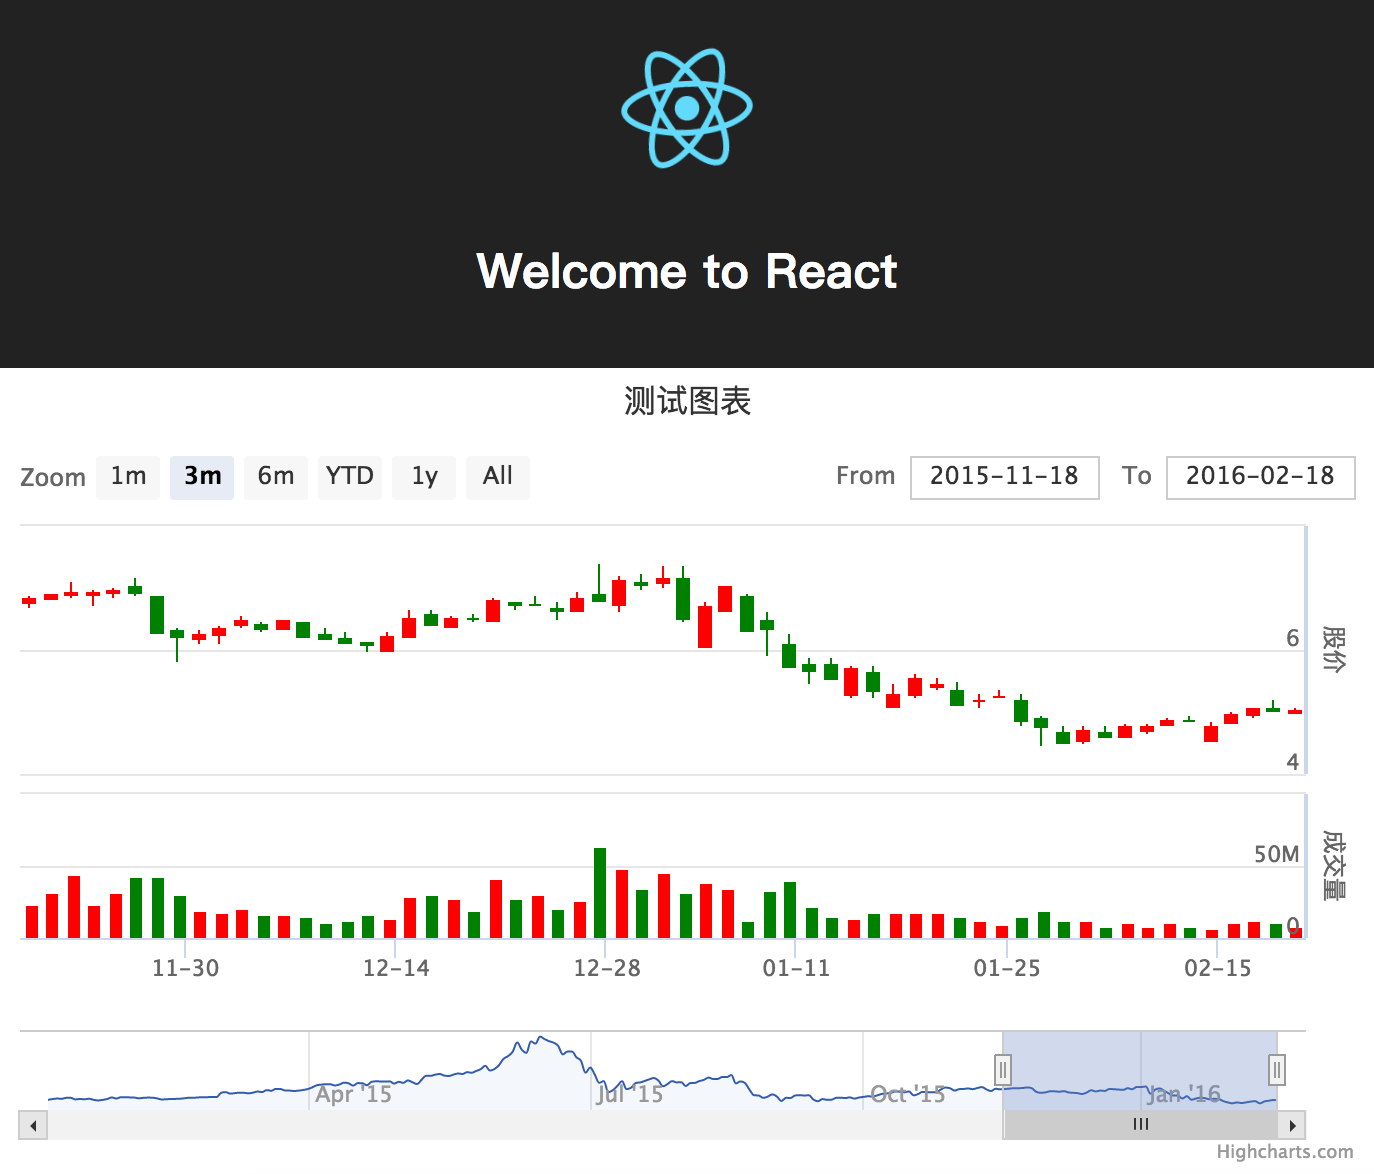
这就是最基本的创建一个 highstocks 图表的案例,以下是完整代码(代码中获取数据的 url 地址我屏蔽了一些私人信息,自己用的时候可以修改为自己的 key 信息)

1
2
3
4
5
6
7
8
9
10
11
12
13
14
15
16
17
18
19
20
21
22
23
24
25
26
27
28
29
30
31
32
33
34
35
36
37
38
39
40
41
42
43
44
45
46
47
48
49
50
51
52
53
54
55
56
57
58
59
60
61
62
63
64
65
66
67
68
69
70
71
72
73
74
75
76
77
78
79
80
81
82
83
84
85
86
87
88
89
90
91
92
93
94
95
96
97
98
99
100
101
102
103
104
105
106
107
108
109
110
111
112
113
114
115
116
117
118
119
120
121
122
123
124
125
126
import React, { Component } from 'react';
import logo from './logo.svg';
import './App.css';

import { json } from 'd3-request';
import { timeParse } from 'd3-time-format';
import ReactHighstock from 'react-highcharts/ReactHighstock.src';

const parseTime = timeParse("%Y-%m-%d");

class App extends Component {
constructor() {
super();
this.state = {
config: {}
}
}

componentWillMount() {
const url = "http://stock.liangyee.com/bus-api/stock/freeStockMarketData/getDailyKBar?userKey=5AD6AB8D906A4FACAC15E6CFAAAAAAAA&startDate=2015-01-01&symbol=600300&endDate=2016-02-20&type=0";

json(url, (err, data) => {
const result = data.result;
let ohlc = new Array();
let volume = new Array();

result.forEach((d, i) => {
const items = d.split(",");
const date = parseTime(items[0]).getTime();

// 用于显示烛台图的数据
ohlc.push([
date, // 转换时间为时间戳格式
+items[1], // 开盘价
+items[3], // 最高价
+items[4], // 最低价
+items[2], // 收盘价
]);

// 用于显示成交量的数据
volume.push({
x: date, // 时间
y: +items[5], // 成交量
color: (+items[1]) - (+items[2]) > 0 ? 'green' : 'red'
});
});

this.setState({
config: {
rangeSelector: {
selected: 1,
inputDateFormat: '%Y-%m-%d'
},
title: {
text: '测试图表'
},
xAxis: {
dateTimeLabelFormats: {
millisecond: '%H:%M:%S.%L',
second: '%H:%M:%S',
minute: '%H:%M',
hour: '%H:%M',
day: '%m-%d',
week: '%m-%d',
month: '%y-%m',
year: '%Y'
}
},
yAxis: [{
labels: {
align: 'right',
x: -3
},
title: {
text: '股价'
},
height: '60%',
lineWidth: 2
}, {
labels: {
align: 'right',
x: -3
},
title: {
text: '成交量'
},
top: '65%',
height: '35%',
offset: 0,
lineWidth: 2
}],
series: [{
type: 'candlestick',
name: 'AAPL',
color: 'green',
lineColor: 'green',
upColor: 'red',
upLineColor: 'red',
tooltip: {
},
data: ohlc,
}, {
type: 'column',
name: 'Volume',
data: volume,
yAxis: 1
}]
}
});
});
}

render() {
return (
<div className="App">
<div className="App-header">
<img src={logo} className="App-logo" alt="logo" />
<h2>Welcome to React</h2>
</div>
<ReactHighstock config={this.state.config}/>
</div>
);
}
}

export default App;